
Performance Overview Dashboard
Access the Performance Overview Dashboard and switch to the graph view to visualize key performance metrics for quick insights.
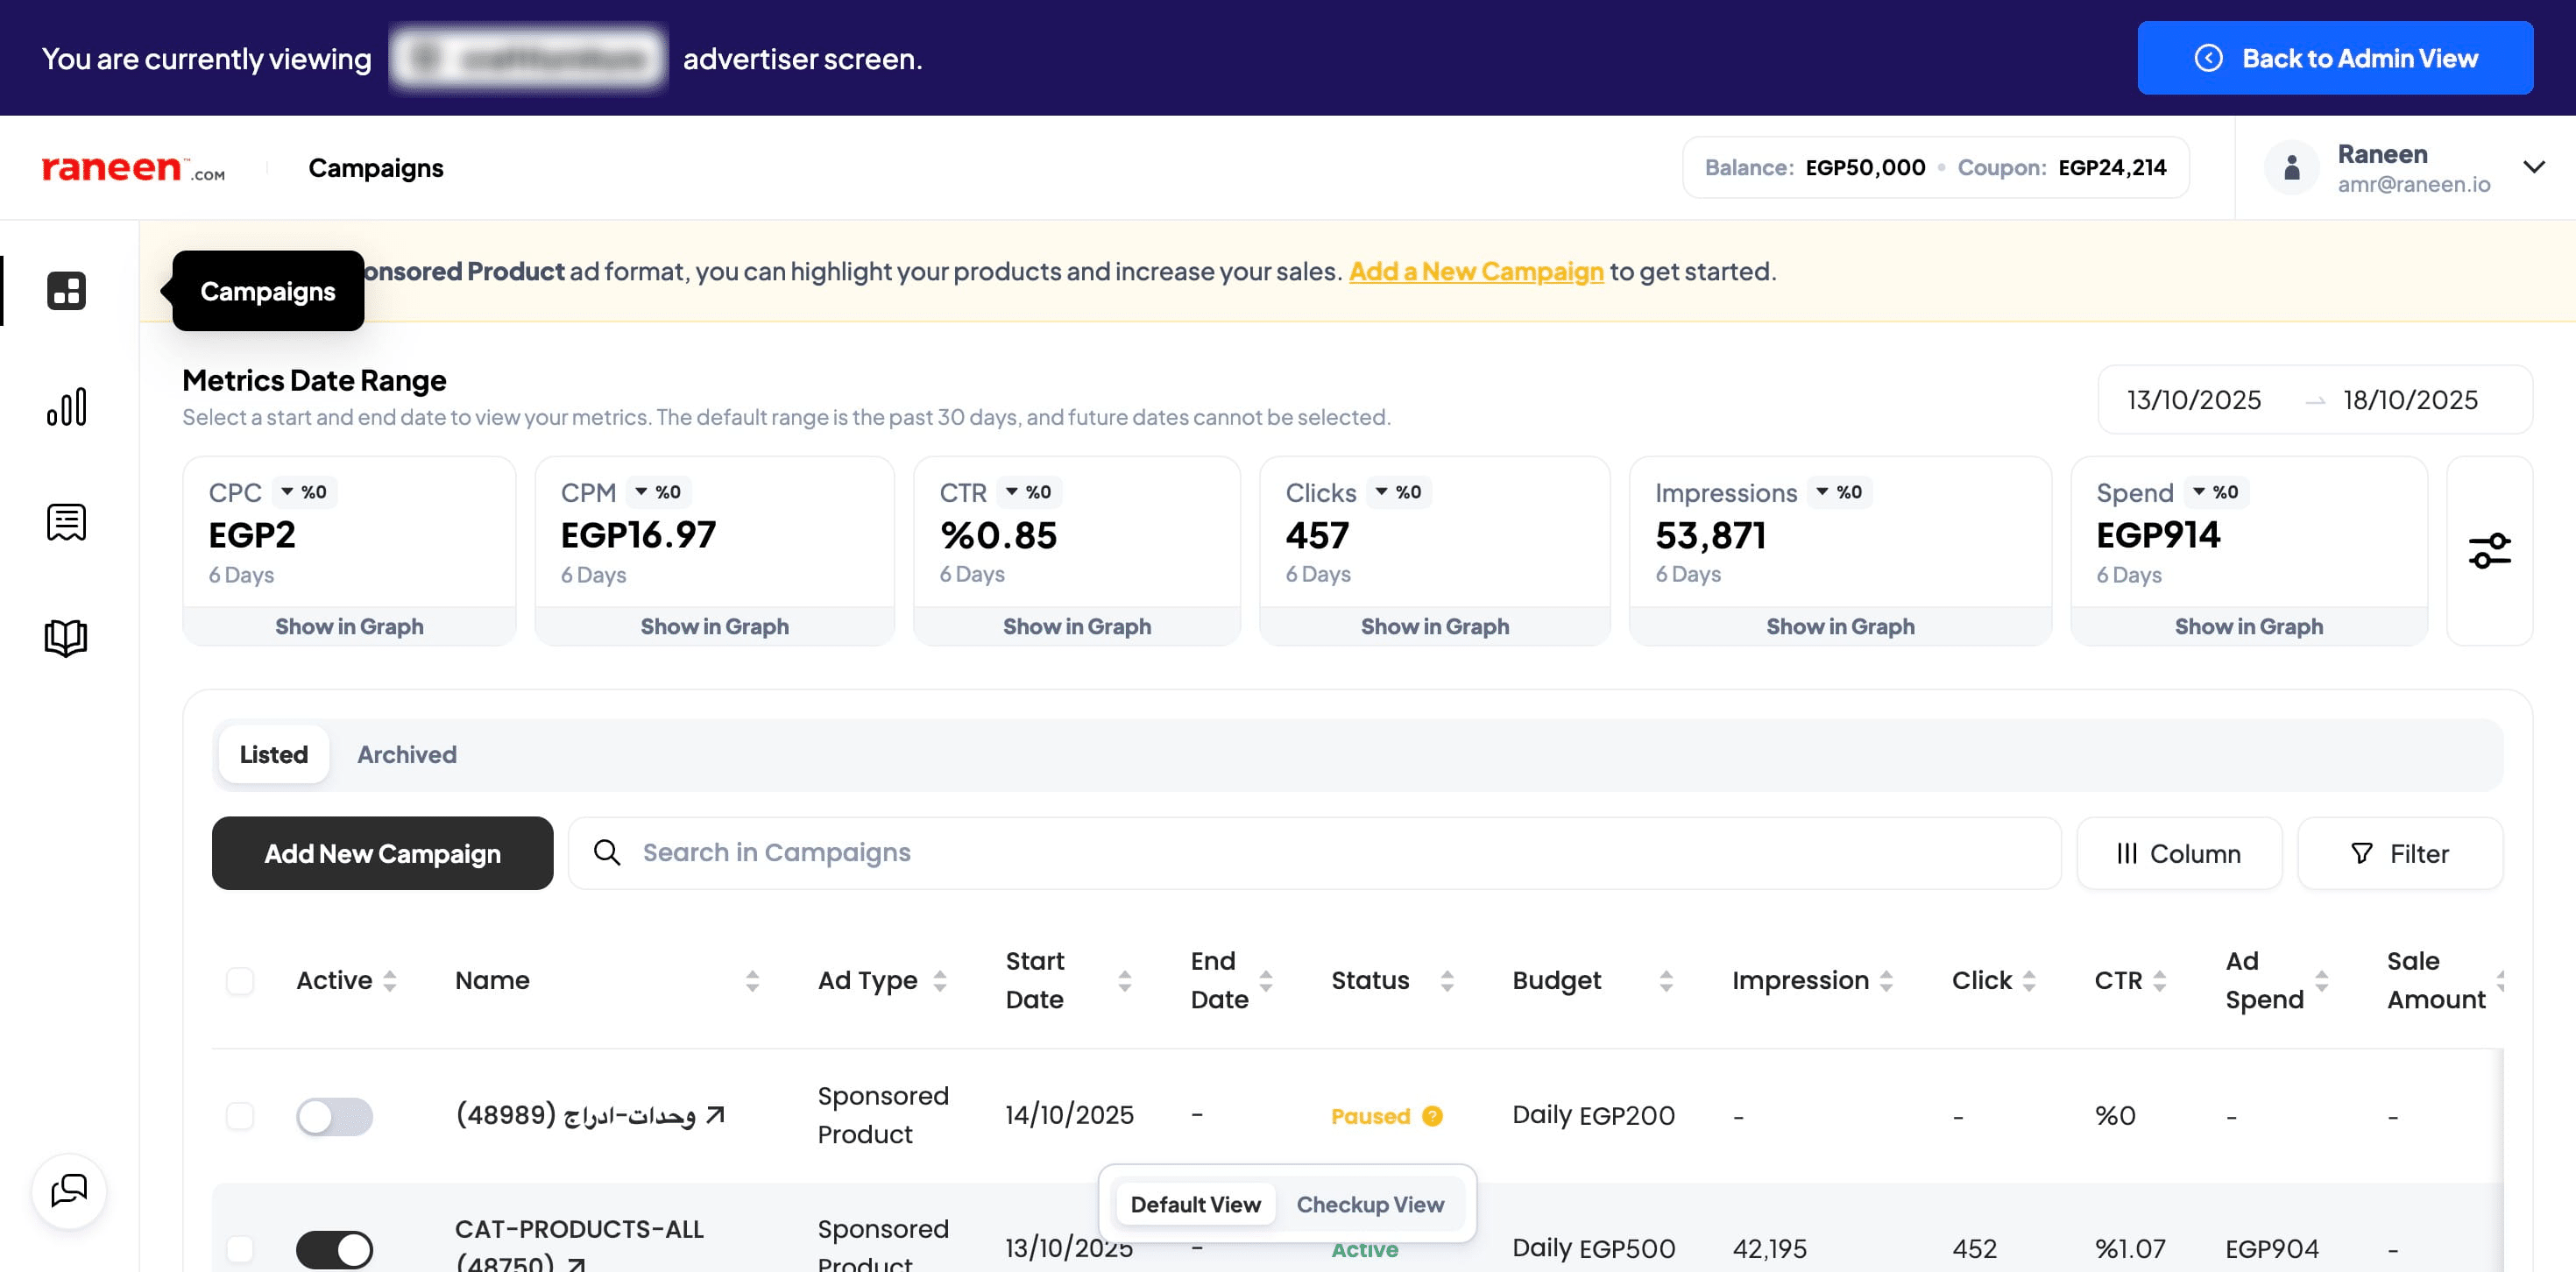
Performance Overview Dashboard
Frequently Asked Questions
- What exact steps does the guide list to open the Performance Overview Dashboard?
Follow the steps in order: 1) Performance Overview Dashboard, 2) Navigate to https://one.raneen.com/, 3) Click on campigns, 4–10) Click on "Show in Graph" (repeated as written), 11) Done 🚀.
- Why is "Click on "Show in Graph"" repeated many times in the steps?
The guide explicitly lists multiple sequential clicks on "Show in Graph". Follow each repeated click as shown in the guide — the repetition is part of the provided procedure and should be performed the number of times listed.
- What should I click after opening https://one.raneen.com/?
After navigating to https://one.raneen.com/, the guide instructs to click on "campigns" (as spelled in the guide), then proceed to the repeated "Show in Graph" clicks.
- How do I know when I've completed the process?
The guide ends with the step labeled "Done 🚀", which indicates the procedure is complete once you have followed the preceding steps.
- How do I open the Performance Overview Dashboard and view a metric graph?
Go to https://one.raneen.com/, click on "campaigns", then click "show in graph" for the metric you want to view.
- Which metrics can I view using "show in graph"?
You can click "show in graph" to see CPC performance, CPM performance, CTR performance, number of clicks (customers who visited your product), how many times your products were visible at Raneen, and advertising spend.
- What does CPM show?
CPM shows how many times your products show in all placements.
- What does CTR mean in the dashboard?
CTR is a percentage comparing how many times your products were visible at Raneen with the percentage of customers who clicked and visited your product.
- If I don't see a metric on the graph, what should I do?
Make sure you clicked "show in graph" for that specific metric from the campaigns view. Repeat the "show in graph" click for each metric you want to display.